 Once again I am back on the weight loss kick. This time we’ve joined a local co-op for a weekly fruit & vegetable basket so that we will have better foods to eat in the house. So far, this is working. We aren’t crazy, we aren’t trying to go vegan or anything, but we have eaten a few meals with little to no meat.
We are also giving juicing a shot. I’m not sure we are ready to go full on with a juice fast or anything, but it is interesting to make up a couple of glasses of vegetable/fruit juice and have it leave me feeling full for hours. If you know me, then you know I almost never feel full – I’m always hungry, except after juice. Weird.
Anyway, being that we are doing the eat better thing, and we also joined a gym, I’ve also started weighing myself. One of the things I hate most about weighing myself is the wild fluctuations you’ll see. According to the Hacker’s Diet, which I don’t recommend as an actual diet guideline but do recommend for learning some facts about how weight and weight-loss works, a lot of your weight change has to do with water, we are 80% water after all, and the odd thing is that people often increase their water intake when dieting. Take this example, you work out one day – running, lifting, etc – but drink a couple of gallons of water; then one day you sit on your ass playing video games and drink a glass of water. Chances are, the workout day may cause you to gain weight and the lazy day will cause you to lose weight. Crazy, right? That’s why you should never let a single day weight-in get you down.
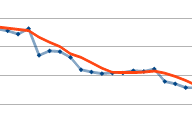
To that end, I created a spreadsheet in Google Docs that will maintain a Three Week Rolling Average. Right out of the gate, let me say that this is only a “three week” thing if you put in a weight every day. If you skip days but don’t skip rows, it’s a 21 latest values average. But, if you don’t skip days on the sheet, and every day you don’t actually weigh yourself you just copy the weight from the previous day, you’ll get a nice running average. Bonus: the second sheet is a graph. Oh, and also, those numbers aren’t real, just an example.
The great thing about the rolling average is that it helps mentally negate a spike in weight. Once you get yourself in the mental space that the number on the scale doesn’t matter and what does matter is the current average once you’ve entered that number from the scale into the spreadsheet, it reduces the anxiety of stepping on the scale. Over time, the average helps smooth out the curve and you can get a picture of the real trend your weight is taking. As humans, we tend to remember bad things more acutely than we do good things, and so we’ll weigh ourselves every day but only remember the days we were disappointed in the number, leading us to feeling like the weight-loss isn’t working. With the average, however, you can see the spikes and valleys and where your real weight actually rests, and that one bad day isn’t the end of the world.
So, copy the document to your own Drive and start tracking. Let me know if you run into any problems with it.